1 MBTA Demographics
According to MBTA’s 2015-17 Rider Survey, available at http://ctps.org/apps/mbtasurvey2018/#navButton, approximately 34.3% of its riders systemwide identify as minority (i.e. non-White or Hispanic). Among minority riders, 10.2% are Hispanic. In addition, 28.8% are low income. This is defined as earning less than 60% of the median household income in MBTA’s service area, which translates to less than $43,500 at the time the survey was conducted.
Figure 1.1 below shows how these demographics vary significantly by mode. It is clear that buses are the most heavily used by minority and low income riders. Relative to their systemwide proportions, minorities and low income riders are significantly overrepresnted on buses. Bus line service is the focus of this analysis.
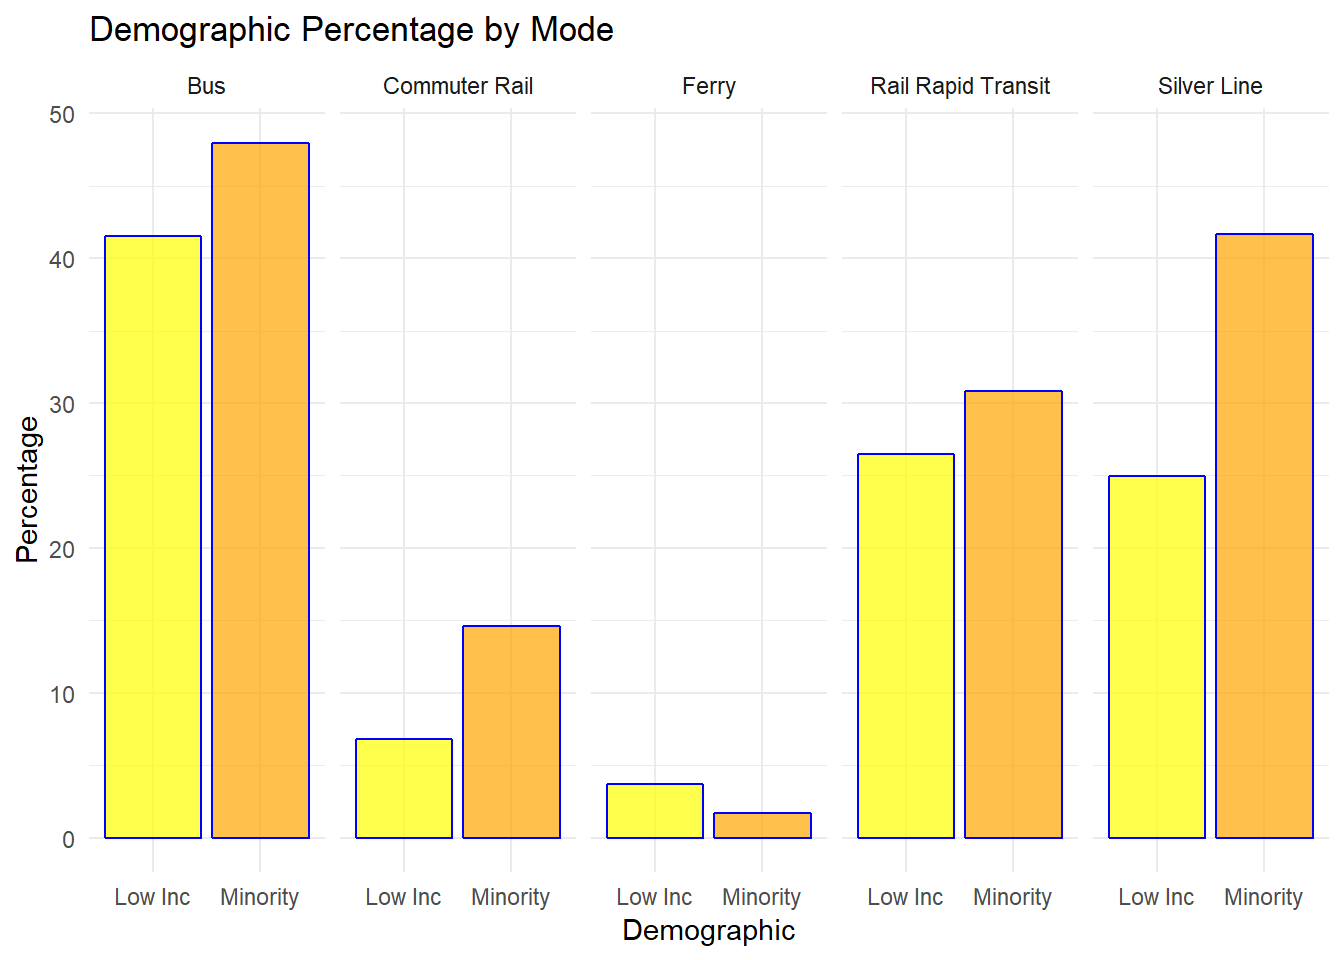
Figure 1.1: Column graph of demographic percentage by transit mode.
For the purposes of Title VI equity analyses, the MBTA typically uses the systemwide percentage to compare minority lines or non-minority lines to other lines. Routes that exceed the systemwide percentage are identified as minority or low income lines, and vice versa.
Because of low survey response rates (or inadequate outreach by surveyors) along certain bus lines, 50 bus lines were aggregated into 23 composite lines of two to three bus lines in order to meet statistical confidence thresholds (e.g., bus lines 114, 116, and 117 are treated as one aggregate line). Notably, these 23 composite bus lines are disproportionately minority. Of these 23 composite bus lines, 60% (14) are minority lines according to MBTA’s systemwide threshold. This is compared to the fact that systemwide, less than 50% of bus lines are minority. The disproportionate lack of demographic data for heavily minority lines is problematic and is compounded in other areas of the survey. The most glaring problem is the almost complete absence of data from non-English or limited English speakers. Although the MBTA offered surveys in five different languages, less than 1% of surveys returned were non-English. This likely means a substantial underestimate of limited English speakers, most of whom are also likely to be minority. The lack of data from a vulnerable minority group means that findings of no disparate or disproportionate impact may not be accurate.
1.1 Minority Bus Routes
Based on the 2015-17 MBTA Rider survey data, 69 bus lines (54.3%) (including composite lines) are identified as minority lines; lines having minority percentages equal to or greater than the systemwide percentage of 34.3%. Although MBTA has made a practice of using the systemwide percentage as its threshold for identifying minority serving lines, it is worth noting that the Massachusetts Environmental Justice policy has long used a 25% threshold to identify minority, low income, or other vulnerable communities. Using that threshold, 98 bus lines (77.2%) (including composite lines) would be considered minority lines. The remainder of this analysis presents both thresholds throughout. The interactive map below (Figure 1.2) shows which lines are considered “minority” under the two different thresholds.
Figure 1.2: Map of bus routes designated as minority.
1.2 Low Income Bus Routes
Based on the 2015-17 MBTA Rider survey data, 75 bus lines (58%) (including composite lines) are identified as low income lines; lines having low income percentages equal to or greater than the systemwide percentage of 28.8%. At the EJ threshold of 25%, 85 bus lines (66%) (including composite lines) would be considered low income lines. The interactive map below (Figure 1.3) shows which lines are considered “low income” under the two different thresholds.
Figure 1.3: Map of bus routes desginated as low income.